Monitoring Progress Chef Automate HA with Datadog

Progress Chef Automate High Availability (HA) enhances the availability and reliability of the Chef platform by introducing redundancy and fault tolerance mechanisms. It leverages multiple instances of Chef Automate and Chef Infra Servers distributed across different nodes or data centers to provide a more resilient and available environment. Equating to reliability, efficiency and productivity, built on Redundancy and Failover, it aids in addressing significant issues like service and zone failures.
It supports two different kinds of deployments:
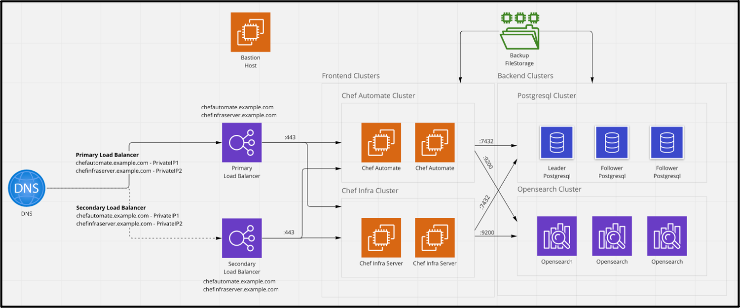
1. On-Premises or Cloud Deployment Without Managed Services
Chef Automate HA components are installed directly on physical or virtual machines in on-premises or cloud environments. In addition to multiple Chef Automate and Infra Server systems, these deployments require instances of OpenSearch and PostgreSQL to be installed with high availability to maintain optimal performance levels.
Scripts handle component installation and configuration when deploying on bare infrastructure. However, it's important to note that these scripts are solely responsible for setting up existing instances and do not create new instances.

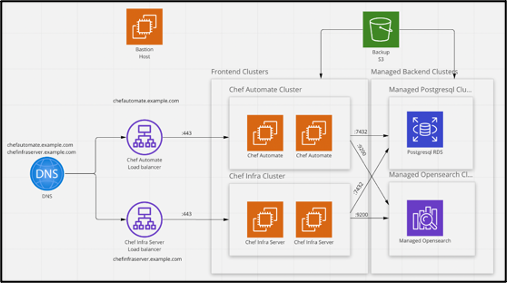
2. Cloud Deployment Using AWS Managed Services
Chef Automate HA in the AWS cloud leverages managed services including OpenSearch and PostgreSQL components. This strategy benefits customers who have adopted AWS Services to take full advantage of the simplicity and scalability of the public cloud. This deployment involves using a set of standard scripts to automate the process of configuring the deployment process and required prerequisites, including creating EC2 instances, load balancers, security groups and subnets.
The cloud deployment of Automate HA on AWS consists of two main steps:
- Provisioning infrastructure: In this step, new infrastructure is created on AWS based on the provided configurations. This includes setting up the required resources for Chef Automate HA deployment.
- Installation: This step involves deploying the services on the provisioned infrastructure. Components such as PostgreSQL, OpenSearch, Chef Automate and Chef Infra Servers are installed and configured during this stage.
By following this AWS deployment approach, organizations can leverage the capabilities of Chef Automate HA in a cloud environment, taking advantage of the scalability, flexibility and managed services offered by AWS.

Monitoring Automate HA with Datadog
Datadog is a monitoring and analytics platform that delivers real-time insights into application, infrastructure, and cloud service performance. It enables organizations to collect, analyze and visualize data from various sources like servers, databases, containers and cloud providers.
With features such as automatic metric collection, log management, distributed tracing and application performance monitoring, users can gain a holistic view of their environment and swiftly identify issues. The platform offers customizable dashboards, visualizations and alerts for monitoring key metrics and detecting anomalies.
Datadog's user-friendly interface, robust search and analytics capabilities and compatibility with different technologies make it a powerful tool for efficient troubleshooting and system optimization.
Why Integrate it with Automate HA?
As an Automate HA customer, leveraging Datadog becomes essential to receive metrics regarding the health and availability of the solution. When deploying Chef Automate HA with Datadog, the depth of visibility, whether running with AWS Managed Services or in on-premises environments, becomes critical for effective monitoring, alerting and visualizations using customizable dashboards.
Users can achieve multiple benefits when utilizing AWS Managed Services. This includes automatic updates on AWS status within the Events Explorer, obtaining CloudWatch metrics for EC2 hosts without the need for Agent installation, tagging EC2 hosts with EC2-specific details, visibility into EC2 scheduled maintenance events, and the ability to collect CloudWatch metrics and events from a wide range of AWS products.
Datadog Agent Configuration
To monitor the Chef Automate HA infrastructure, we need to have a Datadog monitoring agent running on the infrastructure nodes to get the configured metrics and other information to track the overall infrastructure health.
The requirements for the Datadog agent will be dependent on the deployment option the organization has selected for Chef Automate HA.
Automate HA with on-premises or Cloud deployments without Managed Services:
Datadog agent to be configured on:
- Automate nodes
- Infra Servers
- OpenSearch nodes
- PostgreSQL nodes
- Bastion host
Automate HA with AWS Managed services:
Datadog agent to be configured on:
- Automate node
- Infra Server
- Bastion host
The steps for setting up the Datadog agent on the Automate HA systems can be found in this Chef Whitepaper:
More info on setting up of Datadog agent can be found here.
Datadog Integration with AWS for Automate HA
Datadog provides tight integration with AWS for customers leveraging cloud-managed services with Automate HA. This integration uses an AWS CloudFormation template to simplify the configuration and extract all the necessary metrics from the services running in the cloud. These metrics include the PostgreSQL and OpenSearch services running in AWS.
To configure Datadog, navigate to Integration and search for Amazon Web Services, select Configure and then select Add AWS Account.
The selection of Automatically using CloudFormation simplifies the integration by providing just a few parameters such as AWS Region, Datadog API key and other optional settings. Once provided, clicking the Launch the CloudFormation Template will redirect to the AWS console for the final remaining steps.
Tick the necessary checkboxes in the AWS console and initiate the creation of the Datadog stack, including its three nested stacks, by clicking on Create Stack. The stack creation process may take a few minutes, so double-check to see if it's completed before proceeding.
Once the stack is successfully created, return to the Datadog interface and access the AWS integration tile. Select the AWS account and choose the specific AWS resources whose metrics you want to monitor and collect in Datadog.
Learn more in a detailed walkthrough of your Datadog integration.
Datadog Dashboards
To effectively utilize Datadog for monitoring Automate HA, it is crucial to define your goals and identify your target audience. Different teams require distinct dashboards to fulfill their specific needs.
Selecting the right metrics is essential. Not all metrics hold equal importance, so prioritize those that align with your objectives. The provided reference metrics for Chef Automate can serve as a helpful guide for developing metrics and dashboards for other deployment styles.
Utilize suitable visualizations in Datadog based on the metrics you are tracking. Line charts work well for CPU usage, while heatmaps are suitable for tracking errors.
It is recommended you have the following dashboards for Automate:
- Infrastructure Health
- Component Health
- OpenSearch Metrics
- PostgreSQL Metrics
- System Metrics
For example, a System Metrics dashboard will look like this:
Details for how to create Dashboards for Chef Automate can be found in the Monitoring Chef Automate HA with Datadog whitepaper:
More info on setting up of Datadog dashboard can be found here.
Datadog Monitors
With Datadog now collecting all the metrics from the Chef Automate HA environment, Monitors must now be created to watch these metrics and alert when the defined thresholds have been exceeded.
Monitors can be created by navigating to the Monitor section within the Datadog User Interface.
As there are many types of monitors available in Datadog, the following table can be used as guidance for the metrics that should be observed. As each organization has different levels of compliance, these monitoring rules should be used only as an example.
Datadog Alerts
With the Datadog agent deployed, the AWS integration configured, the monitors created, and the dashboards in place, it is time to set up the necessary alerts. Datadog alerts are an essential component of monitoring Chef Automate HA. This enables teams to proactively address performance issues and outages to minimize service disruption. Datadog has several alerting integrations including email, Slack, PagerDuty, Microsoft Teams and ServiceNow.
These integrations can be configured from within the Datadog User Interface. Simply select Integrations from the left-hand navigation and search for the desired communication solution.
Slack Integration:
PagerDuty Integration:
This flexibility ensures the right people and/or processes are notified when issues arise. Alerts are set as part of the Datadog monitors and can be configured under the Notify Your Teams section.
Details for how to leverage different Datadog alert options for Chef Automate can be found in the Monitoring Chef Automate HA with Datadog whitepaper:
- More info on setting up of Slack Integration
- More info on setting up of PagerDuty
- More info on setting up of Microsoft Teams
Regardless of how your organization is leveraging Chef, the availability and performance of the solution should be monitored with the utmost urgency. Leveraging Chef Automate HA coupled with a monitoring solution such as Datadog, gives organizations the confidence that the solution is always available and performing at its peak to deliver the services to scale and grow the business.