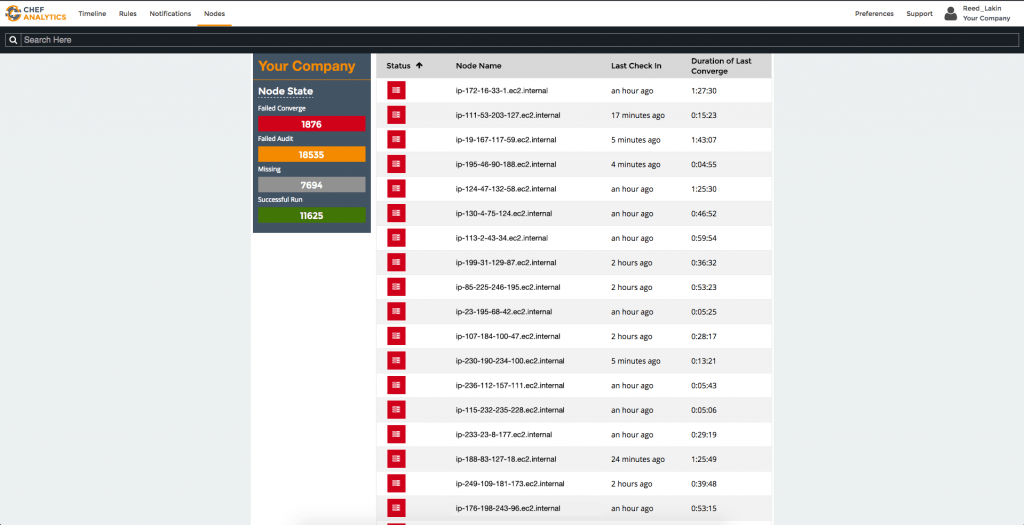
We’re very pleased to announce the release of Chef Analytics 1.1.4, featuring a new look and feel and user experience. We’ve also made it easier in this release to integrate with Splunk Enterprise.
The biggest change in this release is that Chef Analytics now has a view that we call the Node Dashboard. This is a tabular view of all the machines in your infrastructure, color-coded by current state: converging, failing to converge, or converging with control failures from audit mode.

In future releases, we’ll let you drill into the sources of these errors and also be able to show timing information for individual resources.
For best results, use Chef Client 12.4.1 with this version of Analytics if you want to use audit functionality. Prior to this version, Chef Client would not properly separate audit failures from converge failures.
We’ve also made it easier in this release to set up an integration with Splunk Enterprise, without having to use a separate service, and simplified the rule syntax required. Updated directions are here; you do not need a new version of the Splunk App.
We’re excited to know what you think of this new release and in particular, the node dashboard. Please feel free to use our new feedback forum to make suggestions about how we can improve the Analytics product. And if you’re new to Chef Analytics, please attend our webinar on July 14th.
