The blog below is a guest blog post written by Datadog, one of our ChefConf Online sponsors.
Modern environments are complex, consisting of many hosts, Virtual Machines (VMs), or containers that can scale up and down at a moment’s notice. Ensuring consistency across elements of your infrastructure—like running the latest software versions on all your nodes—can be challenging without a configuration management tool like Chef.
Chef Software can help you implement infrastructure as code by creating repeatable processes that streamline the delivery, maintenance, and updating of infrastructure. But as these new components come online, you’ll need a way to monitor their health and performance, so that you can effectively investigate and resolve issues.
That’s where Datadog comes in. When you deploy a monitoring solution like Datadog with Chef, you can implement monitoring as code—allowing you to automatically install, configure, and deploy Datadog to monitor all the components of your environment (resources, nodes, servers, and workstations).
Monitoring as code has a number of advantages, including versatility, flexibility, and automatability. By deploying and configuring Datadog with Chef roles, you can ingest and visualize any data from all of the components of your dynamic infrastructure. Chef can automatically install the Datadog Agent and configure it to collect monitoring data from the nodes and services running in your environment. This removes the need for an engineer to manually configure monitoring checks, and makes it significantly easier to get continuous visibility into your infrastructure as it scales up and down.
Deploy the Datadog Agent
Datadog provides a cookbook to help you quickly start monitoring your Chef-managed infrastructure. This cookbook includes a `dd-agent` recipe, which installs and configures the Datadog Agent, open source software that gathers metrics, logs, traces, and other key data from across your infrastructure. Once you create a role and configure it to run recipes from the Datadog Chef cookbook, Chef can deploy the same role to all your nodes and conduct regular updates (every 30 minutes by default) to ensure that you’re collecting the right data from all your nodes.
For an in-depth guide to deploying the Datadog Agent with Chef roles, take a look at this blog post.
Customize Chef roles with specific recipes
Datadog’s Chef cookbook provides recipes that you can use to collect monitoring data from specific services like Cassandra, Kubernetes, and HAProxy.
In the example below, we modified an example role file to include configuration details for Datadog’s MongoDB integration. This will configure the Agent to collect metrics from the MongoDB instance at the specified address.
name 'example'description 'Example role using DataDog'default_attributes('datadog' => {'agent_major_version' => 7,'api_key' => '<YOUR_DD_API_KEY>','application_key' => '<YOUR_DD_APP_KEY>','mongo' => {'instances' => [{'host' => 'localhost', 'port' => '27017'}]}})run_list %w(recipe[datadog::dd-agent]recipe[datadog::dd-handler]recipe[datadog::mongo])
Once you update your role’s run-list to include specific recipe(s), the Datadog Agent will automatically use those configuration details to collect data from these specific components. Within minutes, you can start visualizing this data in out-of-the-box dashboards—and even set up automated alerts to get notified about important issues.
While the Datadog cookbook provides a foundation for you to start monitoring Chef, it is by no means an exhaustive resource. You can easily extend the Datadog cookbook by creating custom recipes to monitor other integrations, such as applications emitting Prometheus metrics.
Monitor Chef with Datadog
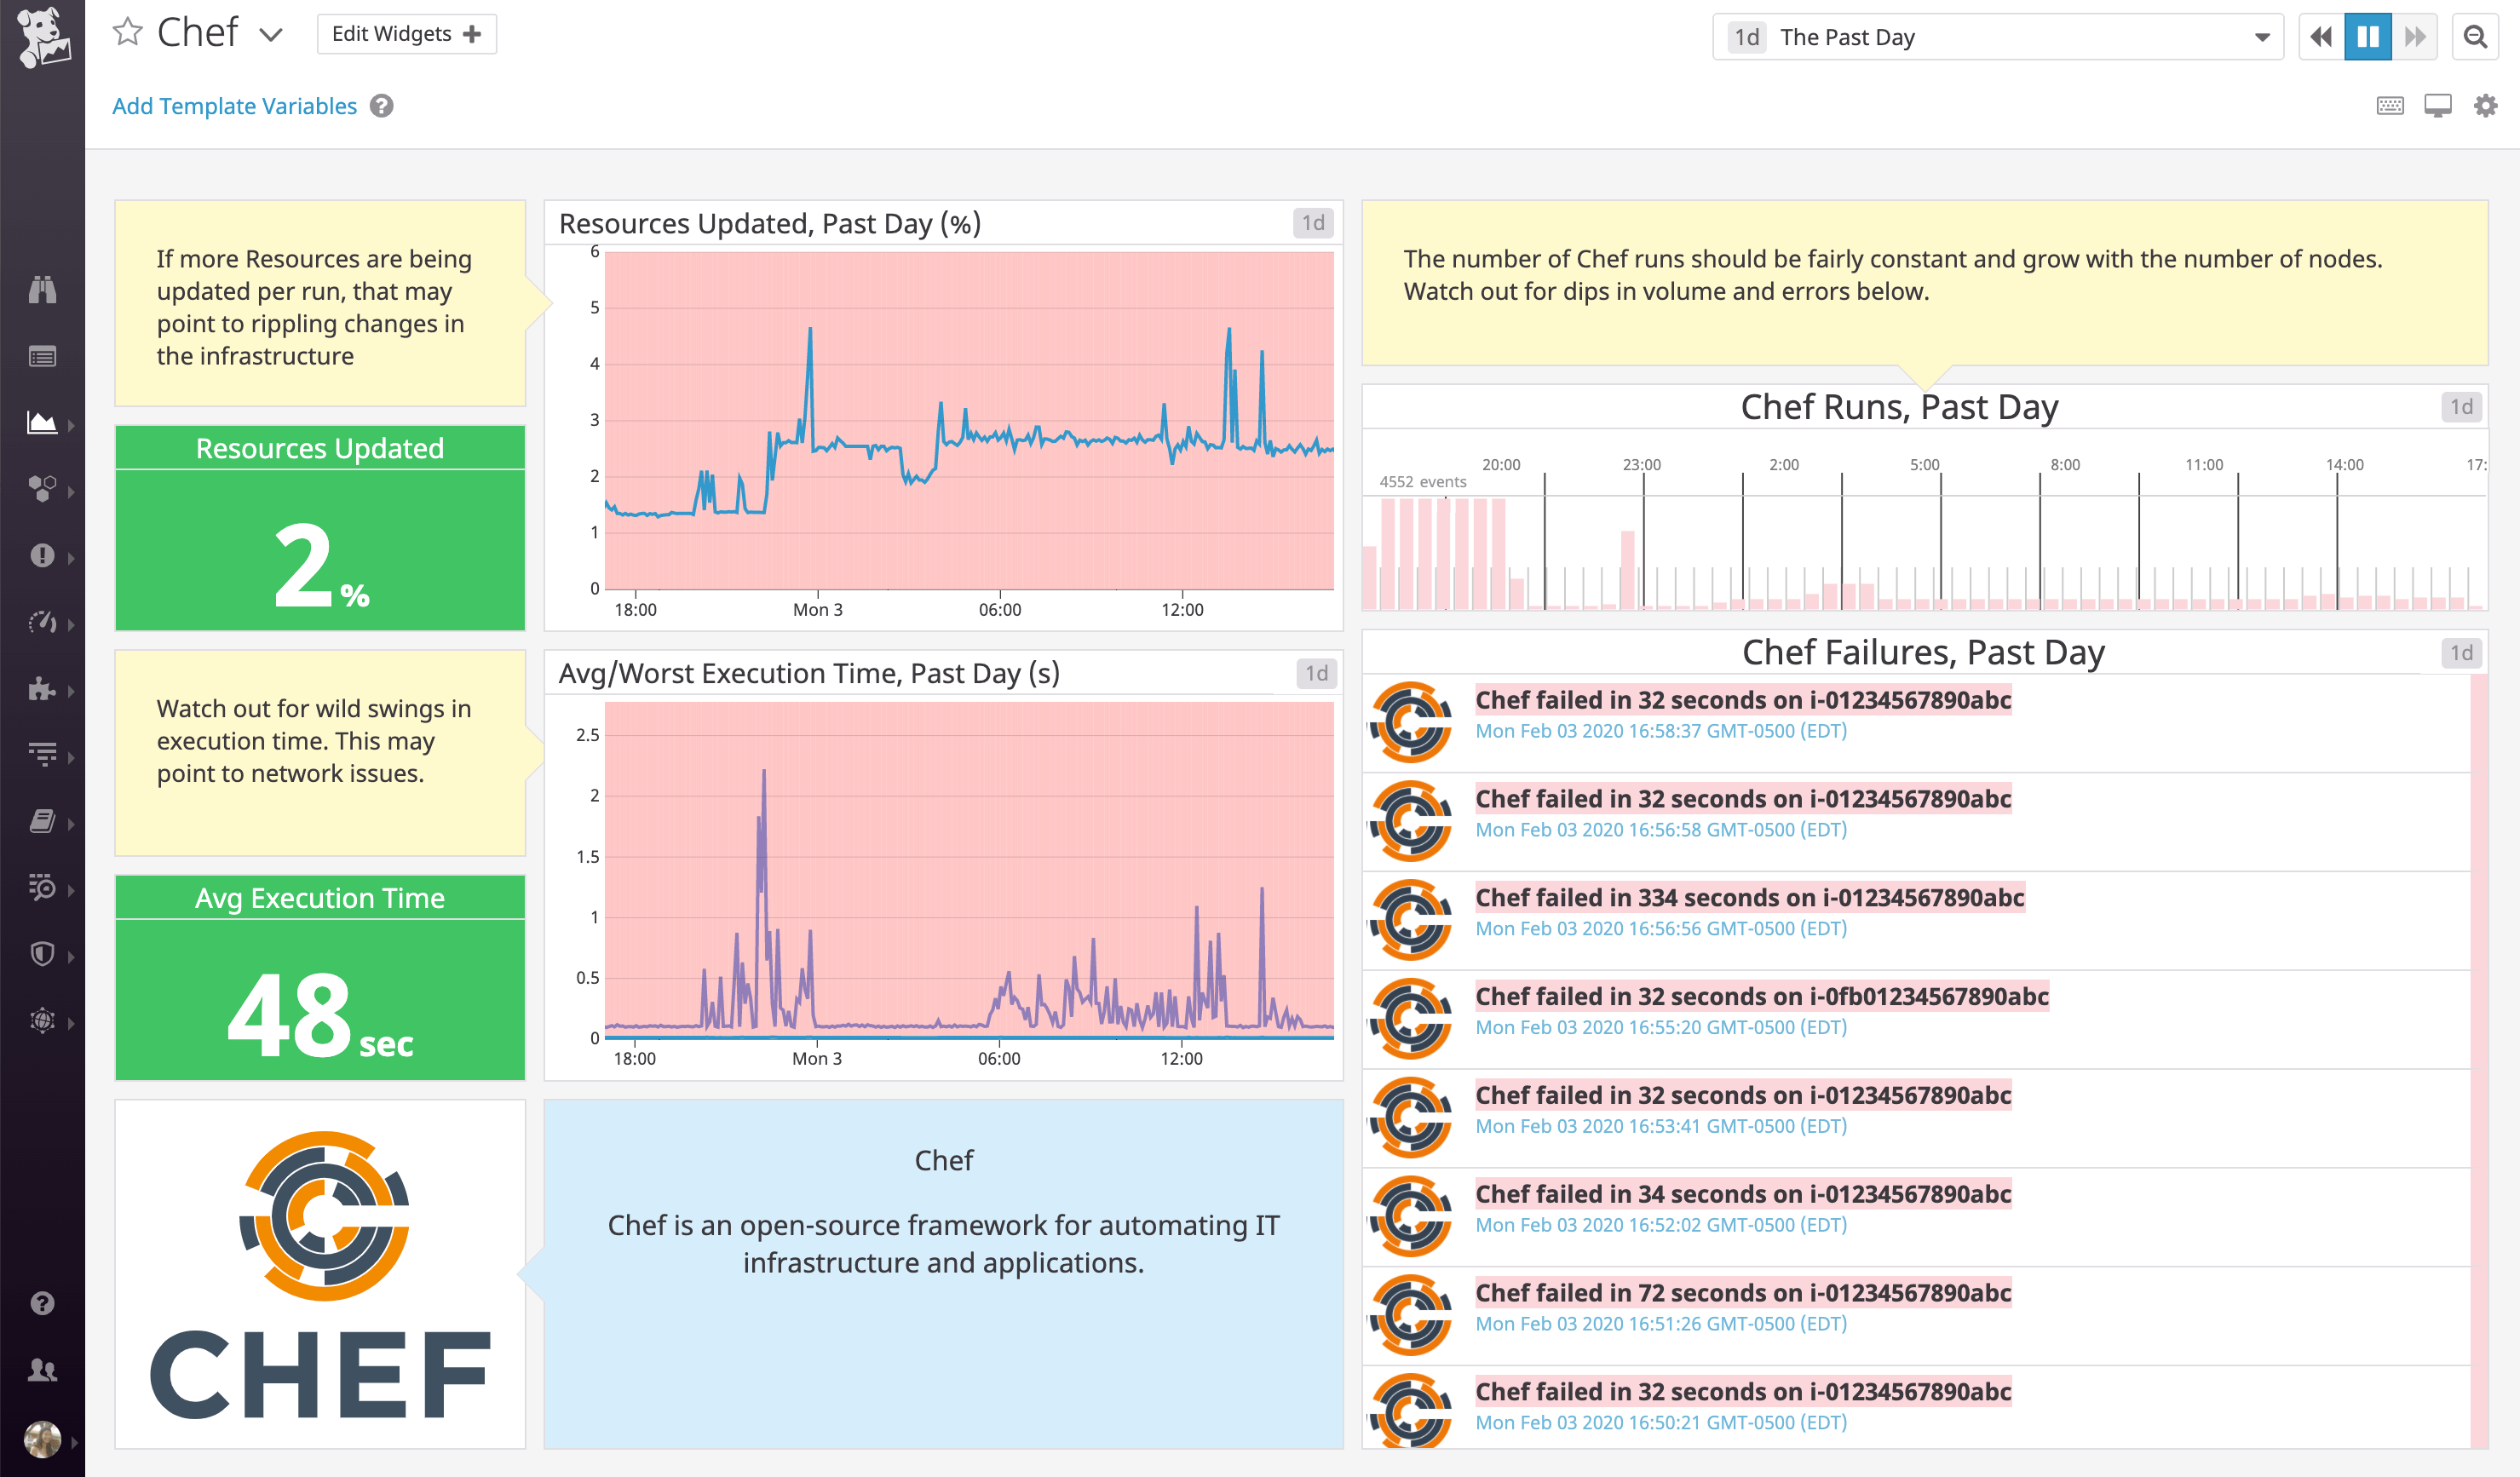
In addition to monitoring the health and performance of your Chef-managed nodes, you can also use Datadog to monitor Chef itself. Datadog’s `dd-handler` recipe installs the Chef Report Handler, which forwards metrics and events from Chef to your Datadog account. Datadog’s Chef integration includes an out-of-the-box dashboard that helps you visualize the real-time performance of your Chef runs, such as execution times, resources updated, and failed/successful runs. As Chef executes changes across your environment, you’ll also be able to correlate Chef events (such as failed runs) with health and performance data from your infrastructure and applications, to get rich context for investigating failed deployments.
Chef and Datadog go together
Chef offers a powerful tool that helps you automatically install, configure, and apply changes across your environment. By using Datadog and Chef in tandem, you can implement monitoring as code, creating a scalable, repeatable, and consistent process to manage and monitor your infrastructure at any scale.
Datadog’s Chef integration also enables you to monitor the status of every run, quickly investigate failed executions, and monitor Chef events alongside real-time performance data from all of your Chef-managed infrastructure components.
To try Datadog in your Chef environment, sign up for a free 14-day trial today.


