High availability (HA) refers to a system or application that offers high operational availability. This means the entire site or application will not be down if one server goes down due to traffic overload or other issues. HA represents that the application remains available with no interruption. You'll achieve high availability when an application continues to operate, even when one or more underlying components fail.
HA isn't just a safety net; it's your ace in the sleeve against service disruptions. Progress Chef Automate HA is your reliability guarantee, weaving efficiency and productivity into the fabric of your system. Redundancy and failover are its building blocks, tackling service and zone failures head-on.
Prometheus is a time-series monitoring tool for managing various system resources and applications. It provides a multidimensional data model, the ability to query the collected data and detailed reporting and data visualization through Grafana.
Prometheus, an open-source tool excels at scraping metrics from HTTP endpoints, making it a go-to for harvesting data from a variety of targets. Platforms for infrastructure (like Kubernetes), business applications and services are all supported targets (e.g., database management systems). Prometheus also works as a flexible metrics collection and alerting tool with its companion Alert manager service.
Features of Prometheus:
- A multi-dimensional data model with time series data identified by metric name and key/value pairs
- PromQL is a flexible query language to leverage this dimensionality
- No reliance on distributed storage; single server nodes are autonomous
- Time-series collection happens via a pull model over HTTP
- Pushing is supported via an intermediary gateway
- Targets are discovered via service discovery or static configuration
- Multiple modes of graphing and dashboarding support
Why Integrate it with Chef Automate HA?
As a Chef Automate HA customer, leveraging Prometheus becomes essential to receive metrics regarding the health and availability of the solution. Whether you're in the cloud with AWS Managed Services or grounded in on-premises environments, weaving Prometheus into your AHA deployment is key for comprehensive monitoring, alerting and crafting personalized dashboards for insightful visualizations.
When using AWS Managed Services, several benefits can be achieved. This includes automatic updates on AWS status within the Events Explorer, obtaining CloudWatch metrics for EC2 hosts without the need for Agent installation, tagging EC2 hosts with EC2-specific details, visibility into EC2 scheduled maintenance events and the ability to collect CloudWatch metrics and events from a wide range of AWS products.
Prometheus Agent Configuration and Installation
By default, Prometheus exporter is enabled to collect metrics on the server where it is installed. With the help of various exporters, metrics can be collected from other resources like web servers, containers, databases, custom applications and other third-party systems.
Prometheus is configured via command-line flags and a configuration file. While the command-line flags configure immutable system parameters (such as storage locations, amount of data to keep on disk and in memory, etc.), the configuration file defines everything related to scraping jobs and their instances and which rule files to load.
Before you can install Prometheus exporters on any Chef Automate nodes, you must do the following:
- Port Configuration - Each Prometheus exporter runs on separate ports. Please ensure all required ports are open from the Prometheus server to exporters.
| Exporters | Firewall Ports |
| Node | 9100 |
| Postgres | 9101 |
| Nginx | 9113 |
| Blackbox | 9115 |
| OpenSearch | 9200 |
| HTTPS | 443 |
- System directory configuration to EC2 machines - The procedure will create an exporter user account, which will be used to configure the node_exporter.
o Connect to the EC2 instance using SSH and enter the below command. This will create a Linux user account, Prometheus and exporter.
$ sudo useradd --no-create-home --shell /bin/false exporter
o Add users and system directories.
These user accounts are created for the sole purpose of management and, therefore, do not require additional user services or permissions beyond the scope of this setup. In this procedure, you also create directories for storing and managing the files, service settings and data that Prometheus uses to monitor resources.
Prometheus Node Exporter Setup
Steps:
- Verify Prerequisites
- Download and install the node_exporter binary package.
o Run the following command to extract the contents of the downloaded Node Exporter files.
$ tar -xvf nodeexporter-1.3.1.linux-amd64.tar.gz
o Enter the following command to copy the node_exporter file from the ./node_exporter* subdirectory to the /usr/local/bin programs directory.
$ sudo cp -p ./nodeexporter-1.3.1.linux-amd64/nodeexporter /usr/local/bin
- Start Node Exporter
o Enter the following command to enable Node Exporter to start when the instance is booted.
$ sudo systemctl enable nodeexporter
- Configure Prometheus for nodeexporter data collector
o Enter the following command to check the status of the Prometheus service.
$ sudo systemctl status prometheus
Verify that these steps are repeated on all the following servers.
- Automate node
- Chef Infra Server
- Managed OpenSearch
- Managed Postgres
- Bastion nodes

Prometheus Postgres Exporter Setup
Steps:
- Verify that the exporter pre-requisite configuration is completed. Refer to the prerequisites section.
- Download, Install, and Configure Prometheus Postgres exporter. Prometheus community page here.
- Start Postgres Exporter
o Enter the following command to start the exporter service.
$ sudo systemctl start postgres_exporter
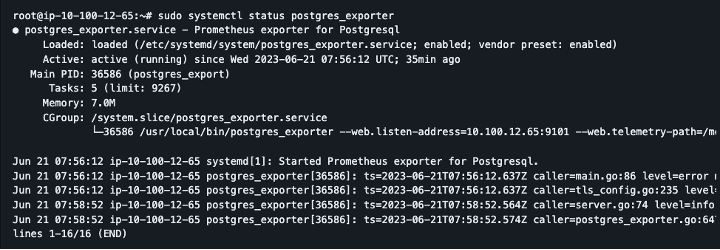
o If the service launched successfully, you would receive an output like the following example:

- Configure Prometheus with the Postgres Exporter data collector.
Confirm these steps are repeated on all the following servers.
- Chef-managed Postgres nodes.
Confirm you are running the steps on Postgres nodes.
Configure Prometheus OpenSearch
Steps:
- Install OpenSearch Plugin
- Configure Prometheus Server for OpenSearch data collection
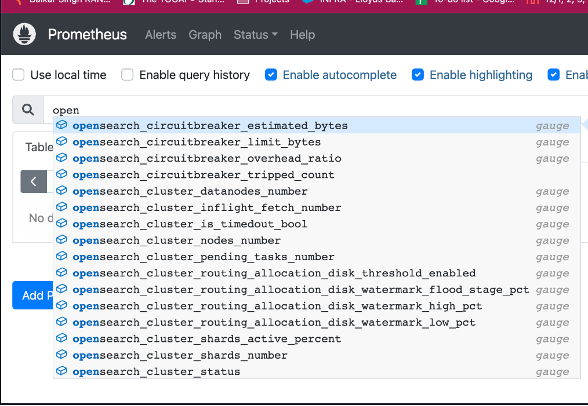
- Verify OpenSearch metrics
Double-check to see if these steps are repeated on all the following servers.
- Chef-managed OpenSearch

Configure Blackbox Exporter
Steps:
- Confirm that the exporter pre-requisite configuration is completed. Refer to the Pre-requisites section.
- Download, Install, and Configure Prometheus Blackbox exporter.
o Enter the following command to create an environment file for the exporter.
$ mkdir /opt/blackboxexporter
$ sudo vi /opt/blackboxexporter/blackbox.yml
o Add the following content to the yaml file. Update the following parameters for your environment.

- Start Blackbox Exporter
o Enter the following command to enable Blackbox Exporter to start when the instance is booted.
$ sudo systemctl enable blackbox_exporter
- Configure Prometheus with Blackbox data collection.
Verify these steps are repeated on all of the following servers:
- Automate node
- Chef Infra Server
Configure Nginx Exporter
Steps:
- Confirm that the exporter pre-requisite configuration is completed. Refer to the Pre-requisites section.
- Download, Install and Configure Prometheus Blackbox exporter.
o Run the following command(s) one by one to extract the contents of the downloaded Exporter files.
$ tar -xvf nginx-prometheus-exporter0.11.0linux_amd64.tar.gz
o Enter the following command to change the ownership of the file to the exporter user that you created.
$ sudo chown exporter:exporter /usr/local/bin/nginx-prometheus-exporter
- Start nginx exporter
o Enter the following command to enable Nginx Exporter to start when the instance is booted.
$ sudo systemctl enable nginx-prometheus-exporter
- Configure Prometheus with nginx exporter data collection.
Verify these steps are repeated on all the following servers:
- Automate node
More information on agent installations can be found here.
Prometheus Download, Installation and Configuration
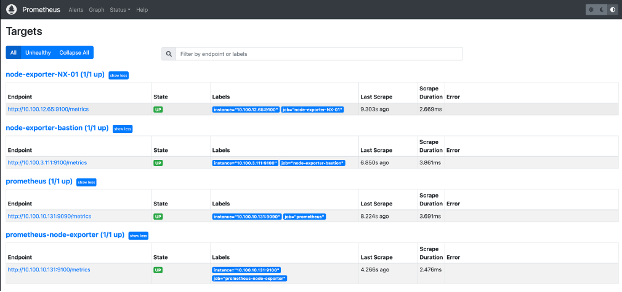
To monitor the Chef Automate HA infrastructure, a Prometheus server must be installed, and exporters must be installed and configured on the infrastructure nodes to get the possible configured metrics and other information that can be sent to the monitoring tool on the server side to track the health of the overall infrastructure.
Steps:
- Complete the prerequisites.
- Add users and local system directories to your EC2 instance.
- Download and install the Prometheus binary package.
o Run the following commands one by one to extract the contents of the downloaded Prometheus and Node Exporter files.
$ tar -xvf prometheus-2.37.0.linux-amd64.tar.gz
$ tar -xvf nodeexporter-1.3.1.linux-amd64.tar.gz
- Configure Prometheus
o Enter the following command to create a backup copy of the prometheus.yml file before you open and edit it.
$ sudo cp /etc/prometheus/prometheus.yml /etc/prometheus/prometheus.yml.backup
- Start Prometheus
- Start Node Exporter
- Configure Prometheus with node Exporter
o Enter the following command to start the Prometheus service.
$ sudo -u prometheus /usr/local/bin/prometheus --config.file /etc/prometheus/prometheus.yml --storage.tsdb.path /var/lib/prometheus --web.console.templates=/etc/prometheus/consoles --web.console.libraries=/etc/prometheus/console_libraries
o Enter the following command to enable Prometheus to start when the instance is booted.
$ sudo systemctl enable prometheus


More information on Download, Installation and Configuration can be found here.
Setting Up of Prometheus Dashboard
The dashboard allows you to analyze data from across your entire system in a single pane of glass. It lets your team immediately benefit from dynamic views without requiring query language or coding.
- Installation and Configuration of Grafana
o This article provides step-by-step assistance on how to install Grafana
Type of Dashboards:
Screenboards: Screenboards are designed for ad-hoc analysis and troubleshooting. They allow you to create a custom layout of widgets and panels to visualize your data.
Timeboards: Timeboards are designed for monitoring and alerting. They show a historical view of your data over time and can be used to set alerts and notifications.
Automate HA Recommendation:
- Component Health Dashboard
- OpenSearch Dashboard
- PostgreSQL Dashboard
- System Dashboard
This article provides detailed guidance to create a dashboard in Grafana.
Steps to create a dashboard for Chef Automate HA component health dashboard. This dashboard will provide the following:
- Status of load balancers for Chef Automate and Chef Infra Servers
- Status of all nodes for Chef Automate and Chef Infra
- Status of all services within each of the Chef Automates nodes
- Status of all services within each of the Chef Infra Nodes.
Prerequisites:
- Chef Automate and Chef Infra server nodes must be configured with the blackbox exporter. Refer to the agent installation documentation for the Blackbox exporter setup.
- Configure the Prometheus server with the required jobs to collect metrics to feed this dashboard.
- Login to the Grafana portal (http://<< ip >>:3000) with your credentials.
- On the left-hand side, click on Dashboards --> New Dashboard. You will be directed to a new Dashboard screen.
Add four new rows and modify the title.
- Chef Automate Load Balancer Status
- Chef Frontend Server Status
- Chef Automate Services Status
- Chef Infra Services Status

Importing a Dashboard:
The Prometheus community has contributed to the various dashboards and the following dashboards may be configured to monitor Chef Automate HA implementation.


The following process explains how to import existing dashboards in Grafana.
- Refer to the Grafana dashboard repository for available dashboards.
- Review the available dashboard that meets your specific requirements.
- Refer to the identified dashboard for its specific exporter configuration requirements.
- Follow the steps to import the dashboard as described in the article.
More information on Setting up a Dashboard Configuration can be found here.
Metrics and Alert-Manager Configuration.
The following section documents the metrics collected by various exporters for Chef Managed Automate HA implementation. Similar metrics may be collected from AWS-hosted deployments. These metrics provide guidance to use and build monitoring rules and dashboards based on these metrics.
The following metrics are recommended to monitor Chef Automate HA implementation.
System Metrics:
| Component | Metrics Experience | |
| CPU Usage |
| |
| CPU Steal | (avg(irate(node_cpu_seconds_total{mode="steal"}[5m]) * 100) by(instance,job))> 20 | |
| System Memory |
| |
| Disk Utilization | 100-(node_filesystem_avail_bytes{mountpoint="/"}/node_filesystem_size_bytes{mountpoint="/"}*100) > 85 | |
| Disk Utilization | 100-(node_filesystem_avail_bytes{mountpoint="/hab"}/node_filesystem_size_bytes{mountpoint="/hab"}*100) > 90 | |
| Disk Utilization | 100 - (node_filesystem_avail_bytes{mountpoint="/hab"}/node_filesystem_size_bytes{mountpoint="/hab"}*100) > 85 | |
| Disk Utilization | 100 - (node_filesystem_avail_bytes{mountpoint="/hab"}/node_filesystem_size_bytes{mountpoint="/hab"}*100) > 90 | |
| Disk Utilization | 100 - (node_filesystem_avail_bytes{mountpoint="/tmp"}/node_filesystem_size_bytes{mountpoint="/tmp"}*100) > 85 | |
| Disk Utilization | 100 - (node_filesystem_avail_bytes{mountpoint="/tmp"}/node_filesystem_size_bytes{mountpoint="/tmp"}*100) > 90 | |
| Host Monitoring | Up==0 |
More information on Metrics and AlertManager can be found here.
The Node exporter provides system-level metrics, e.g. CPU, disk, memory, etc. Refer to the node exporter documentation to learn full capabilities and the node exporter service configuration file for the chef-managed Automate HA deployment.
Configure Application-Level Monitoring
- Install the blackbox exporter on the following servers
- Configure the prometheus.yml file on the Prometheus server to remove metrics for various chef services. Refer to prometheus.yml for the following job configurations.
o All Chef Automate Frontend Servers
o All Chef Infra Frontend Servers
o Any other Server to Monitoring Load Balancers
o Chef-Sever-URL - Monitors elastic load balancer for Chef Infra frontend servers
o Chef-Automate-URL - Monitors elastic load balancer for Chef Automate frontend servers.
o Chef-Server-services.* - Monitors all services running on each Chef Infra frontend server.
o Automate-services.* - Monitors all services on each Chef Automate frontend server.
Installing Alert Manager
- Execute the following command to download and install the alert manager:
o $ curl -LO https://github.com/prometheus/alertmanager/releases/download/v0.25.0/alertmanager-0.25.0.linux-amd64.tar.gz
o $ tar -xvf alertmanager-0.25.0.linux-amd64.tar.gz
o $ mv alertmanager-0.25.0.linux-amd64/alertmanager /usr/local/bin
Configure Alert Manager
Perform the following steps to configure the alert manager:
$ mkdir /etc/alertmanager/
$ vi /etc/alertmanager/alertmanager.yml
Based on Alert integration to Slack, MS teams, and pager-duty, add the following under the receiver section.

Refer to the Prometheus alert manager configuration documentation for detailed options.
Slack Integration:
The following steps guide preparing Slack receivers for the alert manager to send alerts:
- Create a Slack channel
- Select All Channels and click Create Channel
- Specify Channel Name
- Select Visibility
- Once the Channel is created, create a webhook
- Select Manage Apps under Slack Administration
- Search for Incoming Webhooks
- Add incoming hooks to Slack
- Select Channel and click on "Add Incoming Webhook"
- Copy the Webhook API URL
- The api_url will be used in the alert manager configuration

More information on Setting up Slack Integration can be found here.
PagerDuty Integration
The following steps guide preparing PagerDuty receivers for the alert manager to send alerts.
- Access your pagerduty portal with permission to create a new service
- Create a new Configuration Services:
- Assign Escalation Policy and click Next
- Select Integration Service as Prometheus and click Create Service
- After creating the service, copy the service key. e.g. 98c3d3add5xe4fTAMPEREDfdc62. This service key will be used in the alert manager configuration.
o Click on New Service
o Specify Service Name

More information on Setting up PagerDuty Integration can be found here.
Microsoft Teams Integration
The following steps guide preparing MS Teams receivers for the alert manager to send alerts.
- Create a Team and its Channel:
- Create Incoming Webhooks:
- Create a webhook for this channel. An incoming webhook sends notifications from external services to track the activities
- Click on Create
- Copy the Webhook URL and click done. This webhook URL will be used in the next step.
o Create a channel in MS-team where you want to send alerts
o Click on connectors (in channel options), then search for the ‘incoming webhook’ connector

More information on Setting up Microsoft Teams Integration can be found here.
Regardless of how your organization is leveraging Progress Chef, the solution's availability and performance should be monitored with the utmost urgency. Leveraging Chef Automate HA, coupled with a monitoring solution such as Prometheus, will give organizations the confidence that the solution is always available and performing at its peak to deliver the services to scale and grow the business.
Reference:
- Read on how you setup Chef Automate HA with AWS Managed Service
- Read on how to integrate Datadog with Chef Automate HA

